
available upon request
Geospatial Explorer
Let users explore your data
A configurable web dashboard to display and visualize geospatial data
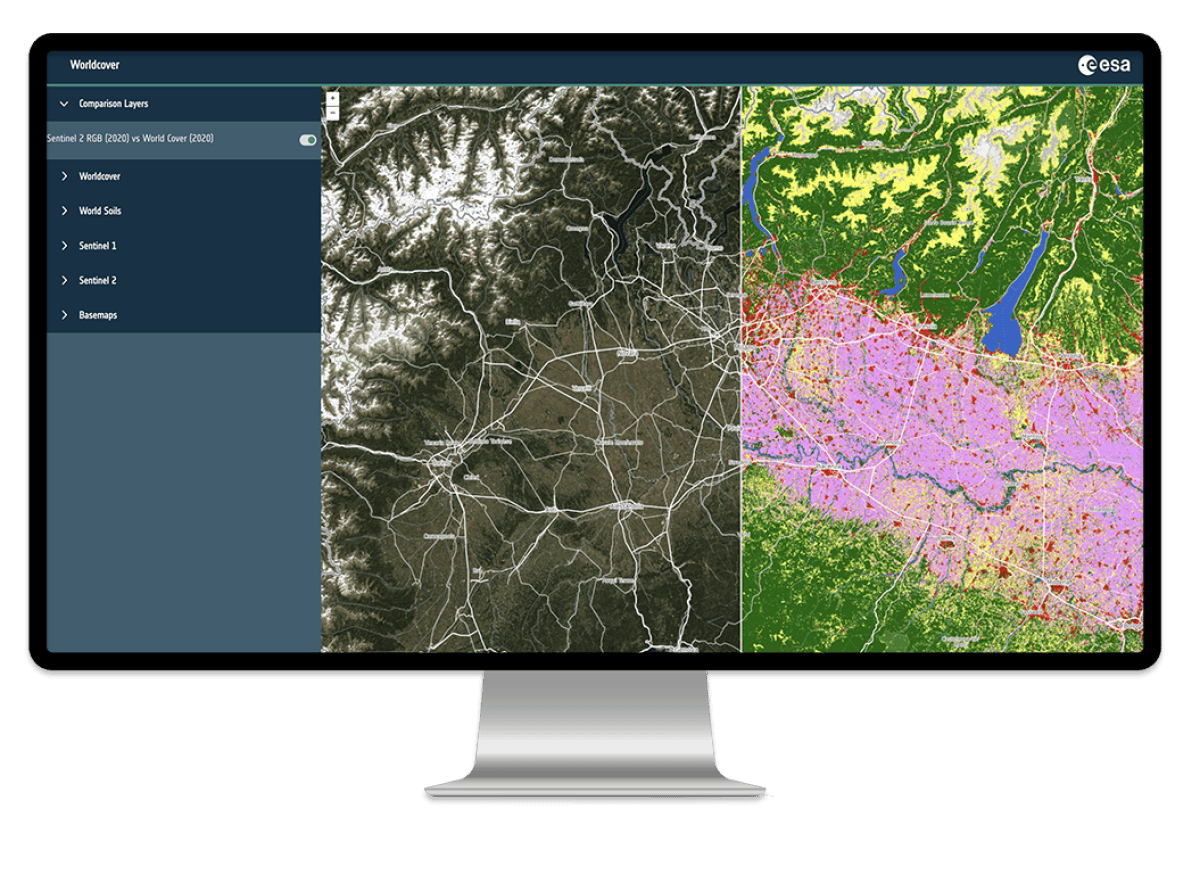
Typical functions will include the ability to visualize EO data, derived products and associated vector layers (e.g. administrative boundaries), with control over layer ordering, transparency, product comparisons (split screen) and support for features such as cursor inspection, queries, distance measurements and visualization of tabular data via integrated charts and graphs.
The UI will also provide access to metadata records to provide traceability of data included in the dashboard By leveraging the Geospatial Explorer service, projects can create custom, interactive dashboards that enhance the understanding and dissemination of geospatial data and project results. This service is designed to be flexible, user-friendly, and compatible with a variety of data sources, making it a valuable tool for both technical and non-technical users.
Included features
Discover powerful tools for visualizing raster, vector, and tabular data with interactive features. Create engaging time series and geospatial stories, and customize dashboards effortlessly—no coding required. Seamlessly integrate with APEx services and existing data sources for a complete solution.
Interactive tools
Supports the visualization of raster, vector, and tabular data combined with interactive tools to explore the data
Visualization
Enables data and time series visualization, and geospatial storytelling.
Configurable
Administrators can configure dashboards to meet specific needs without programming knowledge.
Integration
Integrates with other APEx services and existing data sources.
Key benefits

Dissemination
Supports the dissemination of project outcomes to stakeholders and a broader community.

Integrate multiple data sources
Facilitates reaching useful insights by combining interactive tools with the ability to integrate multiple data sources using common interoperable protocols.

Easy access
The intuitive UI design improves accessibility to project results, even for users without advanced technical skills.

Interactive platform
Seamlessly combines geospatial and tabular data into a unified, interactive platform, creating a holistic view.


